This week I listened to a fascinating TED Talk (Thank you, Priscilla!) by David McCandless who explored the idea of data visualization as a kind of language that can tell stories to more accurately, rapidly, and thoroughly convey complex information to the public. Infographics seem to be a very popular theme in our UX Pattern boards, and I think that relates to the idea that people find information presented in a visual context particularly attractive and easy to grasp. Good data visualization designs capitalize on our human capabilities for pattern recognition, and can make us better informed consumers and citizens of the world. McCandless made a great point about how we hear figures quoted in news media outlets (military budget at blah-blah billions of dollars, this-many thousands of new cases of blah-blah flu, etc ad nauseum) presented outside of the broader context. He displayed some interesting slides for comparison that gave me the Ah-ha moment, “So that’s why I automatically tune out when I hear large numbers quoted on the news about world events, disasters, and government spending.” Information (particularly in the form of numbers and large data sets) presented out of context conveys no meaning for people. Big data can’t be understood readily unless it’s presented to us in a way that is both visual and relative to other numbers. Since my goal at Kent State is to complete an informal dual Master of UX and Data Science, I’ve been considering the various areas in which these two relatively nascent fields of study overlap, and data visualization is an area of mutual concern with dazzling potential for helping people.
It’s no secret that we as Americans perceive that we exist in a partisan political landscape with a great gulf that is growing with each election. But what if this perceived gulf was much smaller than we realize? When people listen to AP news outlets, read Facebook posts of dubious veracity, or watch popular pundits on Fox or MSNBC, they seem to come away with an impression that right and left can’t and won’t understand each other, and the bad people are those on the “other side.” I would argue that this is simply a form of elaborate distraction; the real enemy isn’t your redneck neighbor who thinks pedophiles are going to come out of the woodwork en masse to invade our bathrooms, or your bleeding-heart aunt who listens to nothing but NPR and won’t shut up at the family dinner table about how terrible Scott Pruitt’s nomination will be for the EPA. The real enemy is the ultra-powerful, ultra-wealthy minority who are running things in this country for the benefit of themselves and their friends, at the expense and on the backs of the rest of us.
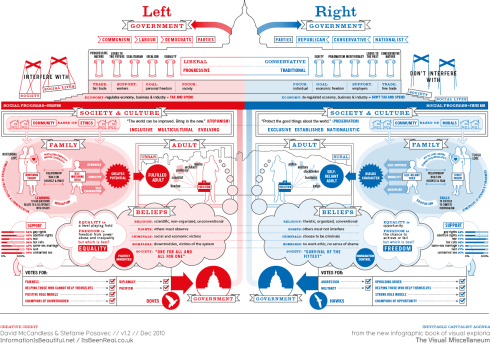
Among the great examples McCandless discussed in his talk was a political slide that compared the concerns and values of people on the left and right. I might be shooting for moon here, but if political information about “the other side” could be conveyed to people in a way that is non-threatening, non-pandering, and unbiased, perhaps more common ground could be realized among people who are probably much more alike than they are different. To get to my point, if the potential of design and data could be harnessed to talk to people in a language they can understand much more saliently and thoroughly, perhaps then data designers could empower people by broadening their perspective, then changing their perception, and finally, balancing their worldview. Perhaps then people could see our current political landscape for what it is and what, really, it has always been: stratified, with the rich and powerful few at the top and the rest of us at the bottom. McCandless sums up quite eloquently the necessity for intelligent data design to compress thick information that might otherwise be ignored, skewed, or misunderstood: “We need relative figures that are connected to other data so that we can see a fuller picture, and then that can lead to us changing our perspective. As Hans Rosling, the master, my master, said, ‘Let the dataset change your mindset.’ And if it can do that, maybe it can also change your behavior.”
What a brilliant idea – now I just need to learn how to do it.
